This weekly Market Update covers mortgage rates, economic releases and housing trends for real estate and mortgage industry professionals.
Mortgage Rate Index
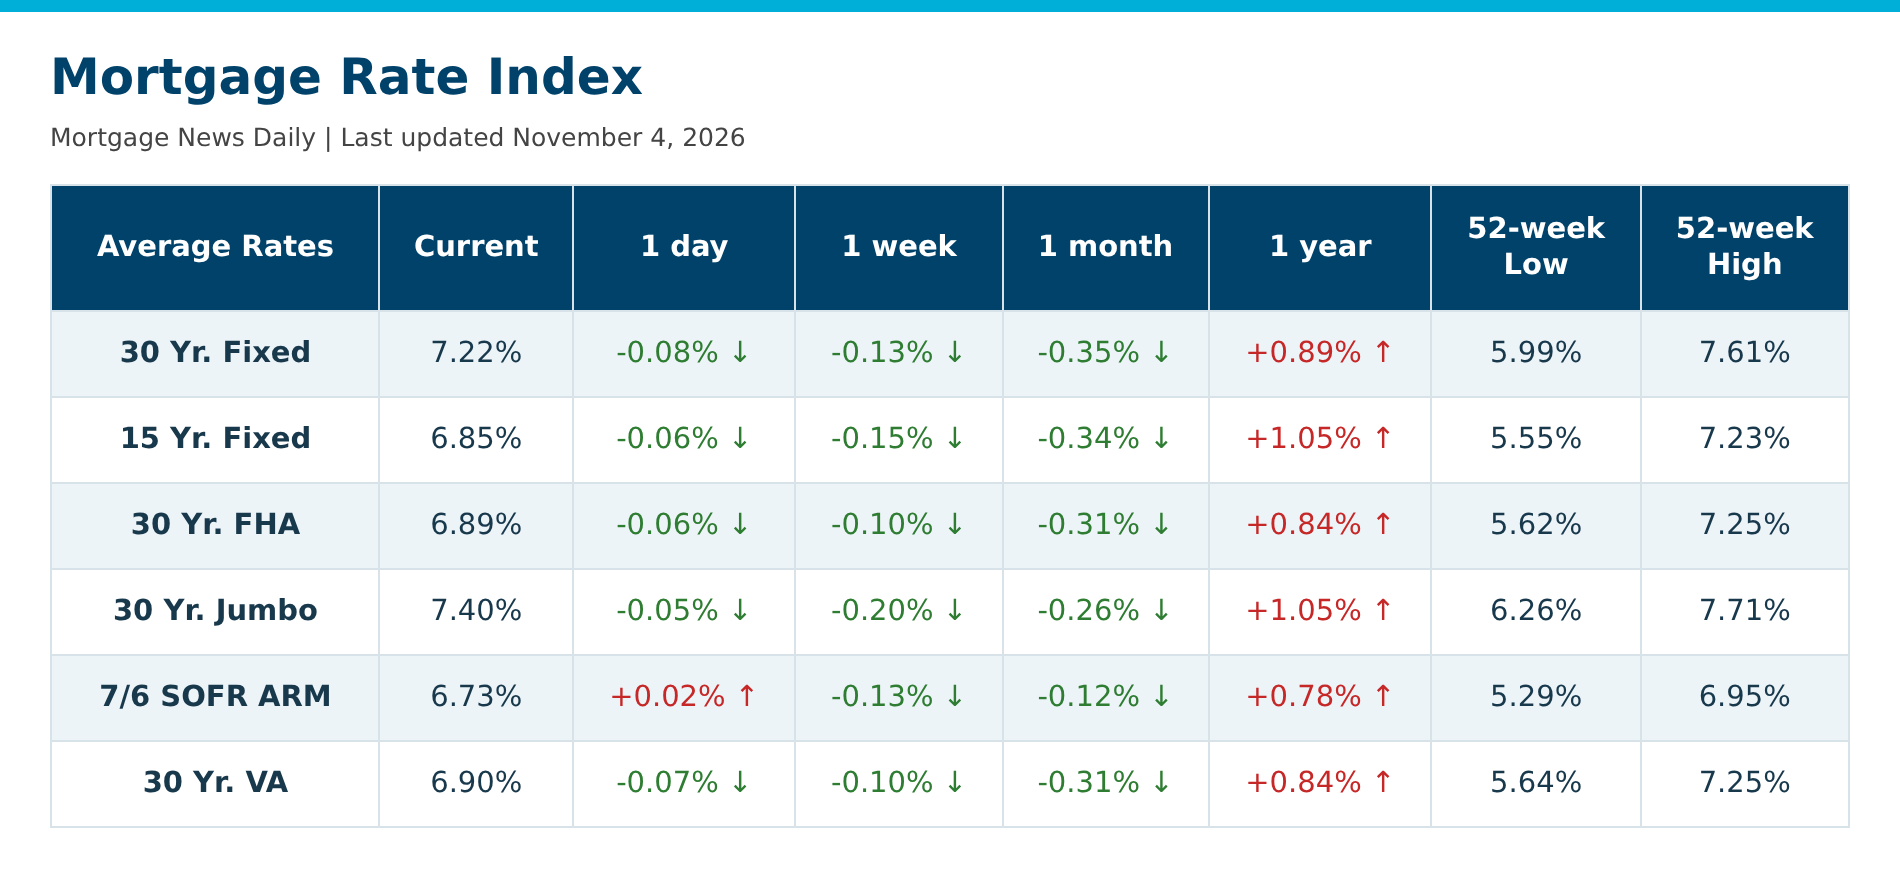
Rates are provided by Mortgage News Daily. The MND Rate Index is the best way to follow day-to-day movement in mortgage rates. The index is driven by real-time changes in actual lender rate sheets. This has two huge advantages, timeliness and accuracy. A "top tier" scenario is used as a baseline (75 LTV, 780 FICO, etc.). Mortgage News Daily uses proprietary methodology to adjust the rate to account for points. That can mean that lenders are quoting 6.125 with points while our index is at 6.25, hypothetically.
Market Commentary
The Mortgage News Daily 30-year fixed index was 7.22% on November 4. In the separate Freddie Mac series shown below, the 30-year fixed average was 7.24% on October 29, down from 7.32% the prior week. Overall mortgage applications dipped 1.2%, while the adjustable-rate mortgage share rose to 11.4%.
Inflation remains sticky, prompting a "higher-for-longer" rate outlook from the Fed. To combat affordability challenges, 43% of homebuilders are cutting prices (averaging a 6% cut) and roughly 65% are offering incentives like rate buy-downs.
Buyers and sellers are taking a cautious approach. Some sellers are adjusting prices or taking their listings off the market. The November 2 rollout of the UAD 3.6 appraisal standard for conventional loans also makes it worth confirming which appraisal format applies to each loan in the pipeline.
For buyers weighing affordability, compare new construction incentives with seller concessions on resale homes. A temporary buydown, such as a 2-1 structure, may reduce initial payments. Compare the full payment after the buydown period when evaluating options.

Key Factors Impacting Direction of Rates
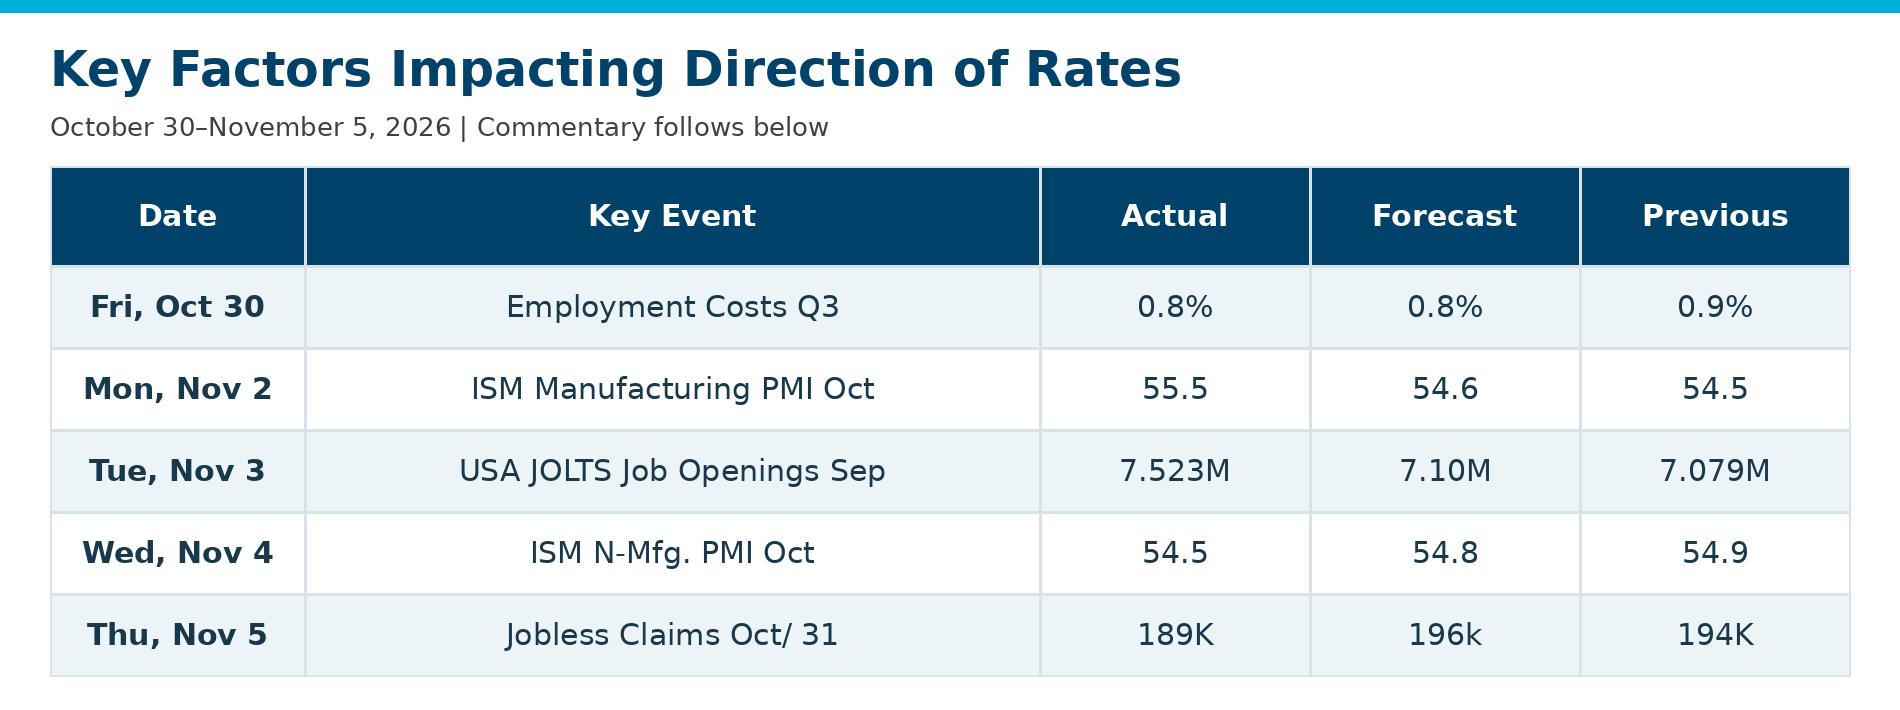
Employment Costs Q3: The Q3 2026 Employment Cost Index (ECI) and related productivity/labor cost data from the U.S. Bureau of Labor Statistics show moderation in employer compensation costs alongside a surge in productivity.
ISM Manufacturing PMI Oct: The ISM Manufacturing PMI Report registered 55.5% in October 2026, increasing by 1.0 percentage point from September's 54.5% reading and marking the 10th consecutive month of expansion.
USA JOLTS Job Openings Sep: Job openings increased by 333,000 to 7.52 million (up from an upwardly revised 7.19 million in August), beating economist expectations of roughly 7.10M to 7.15M.
ISM N-Mfg. PMI Oct: The U.S. ISM Services PMI (formerly Non-Manufacturing PMI) registered 54.5% in October 2026, slightly missing analyst expectations of 54.8% to 54.9% and dropping from September's reading of 54.9%.
Jobless Claims Oct/ 31: U.S. initial jobless claims fell to a seasonally adjusted 189,000 for the week ending October 31, 2026, according to the U.S. Department of Labor.
FedWatch: Target Rate Probabilities
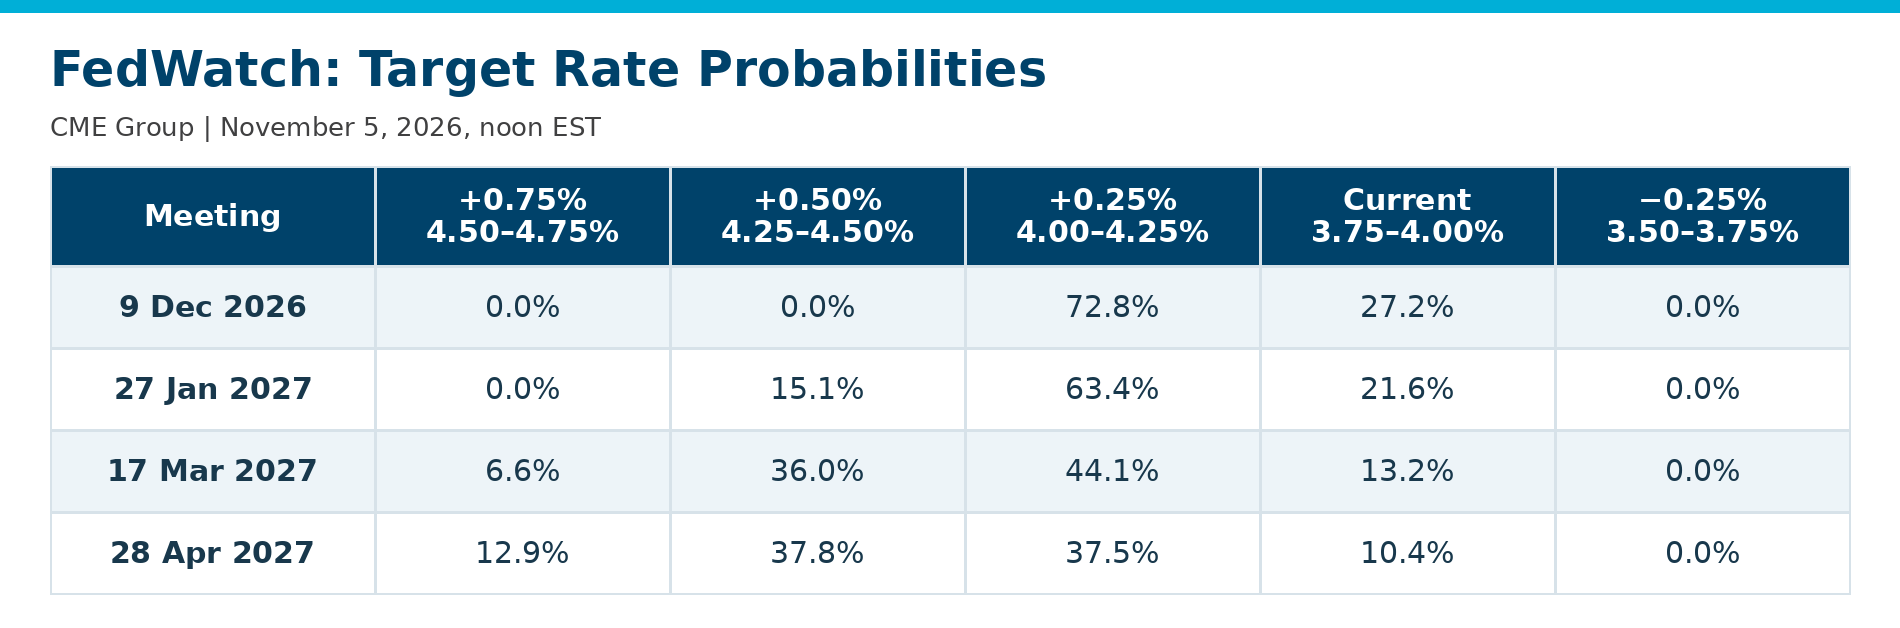
FedWatch: Target rate (in bps) possibilities, according to the CME Group (as of 11/5/2026 – 12:00 PM EST):
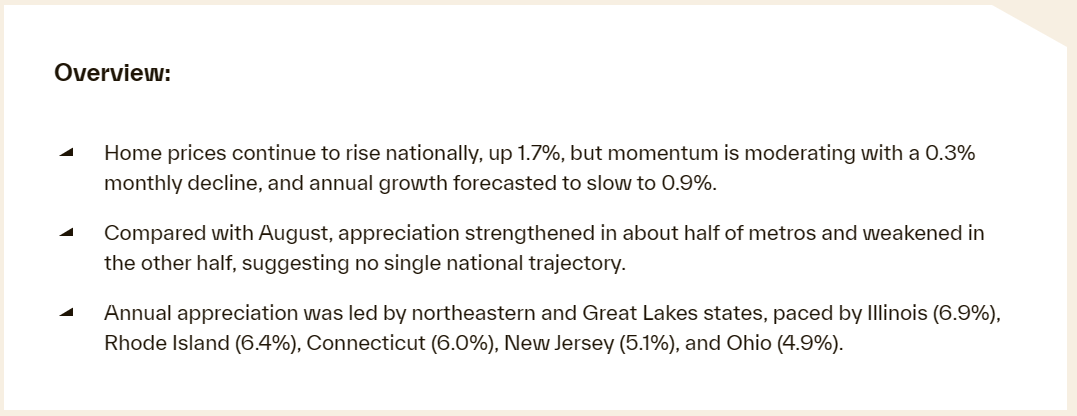
US home price insights — November 2026

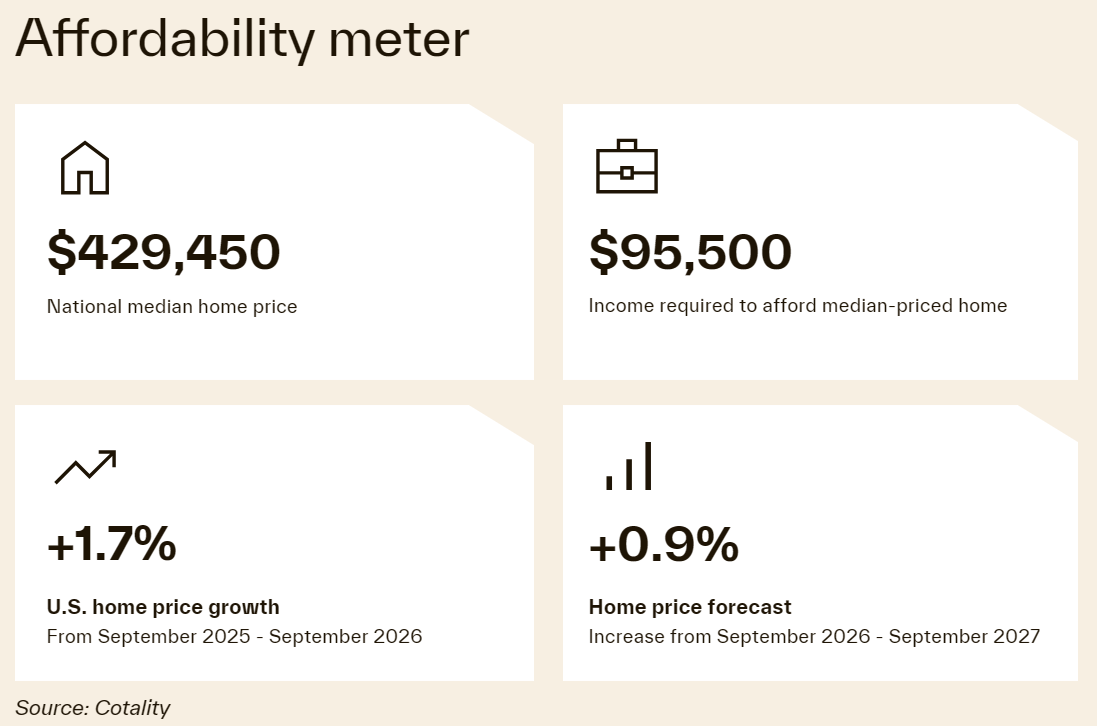

October 2026 Housing Report: Buyers and Sellers Pause

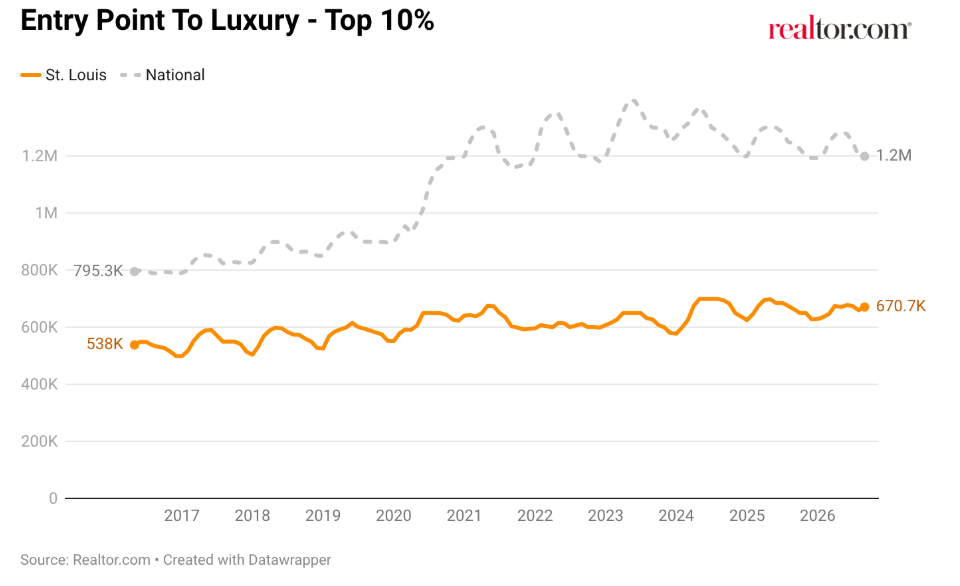
Fall 2026 WSJ/Realtor.com Luxury Housing Market Ranking
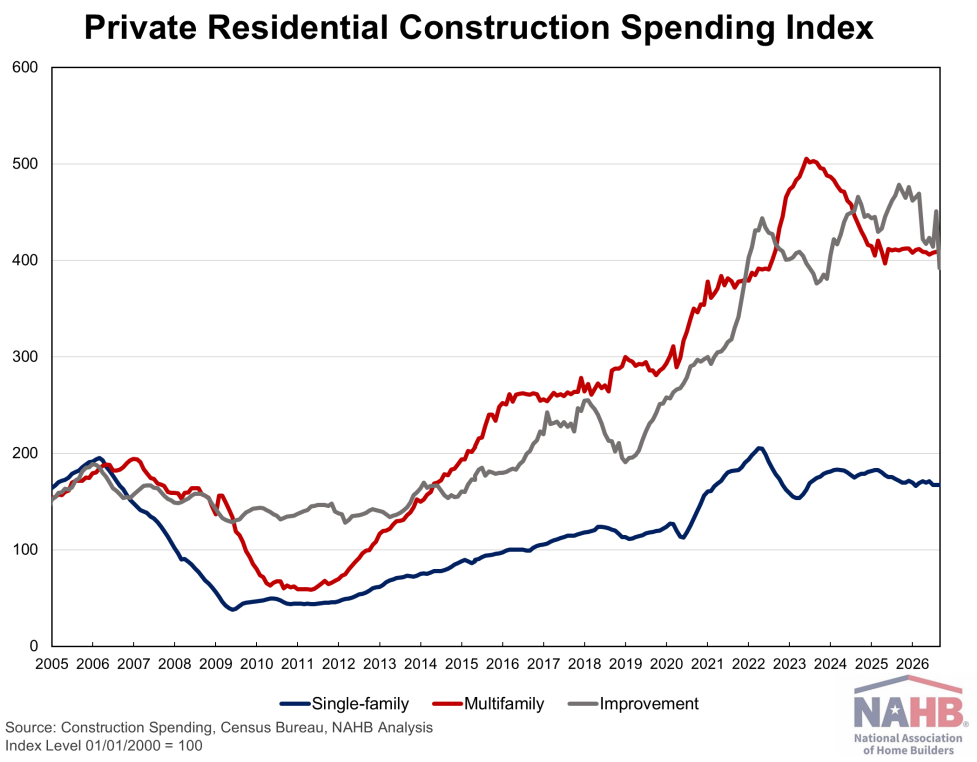
Private Residential Construction Slips as Remodeling Weakens
Wage Wipeout
With the unemployment rate at 4.2%, the labor market is relatively tight, yet wage and salary growth has been anemic at 3.1% Y-o-Y (less than inflation), compared with 3.6% a year ago. Rising employer healthcare costs, up a stunning 6.4% Y-o-Y on top of a staggering 6.1% a year ago, are likely why. Employers are spending so much on healthcare that it’s crowding out wage and salary increases. - Elliot Eisenberg, Economist
News You Can Use
- The US economy before the 2026 midterms, in five charts
- Private companies added 86,000 jobs in October, slightly higher than expected, ADP says
- Mortgage rates dropped again, but homebuyers are still leaving
- Construction Job Openings Rise in September – Eye On Housing
- Fed’s Logan: At least two more quarter-point rate hikes needed
Disclosures
*Communication is intended for Industry Professionals only and not intended for Consumer Distribution
Interest rate and annual percentage rate (APR) are based on current market conditions as of 11/5/2026, are for informational purposes only, are subject to change without notice and may be subject to pricing add-ons related to property type, loan amount, loan-to-value, credit score and other variables. Estimated closing costs used in the APR calculation are assumed to be paid by the borrower at closing. If the closing costs are financed, the loan, APR and payment amounts will be higher. Contact us for details. Additional loan programs may be available. Accuracy is not guaranteed, and all products may not be available in all borrower's geographical areas and are based on their individual situation. This is not a credit decision or a commitment to lend. actual interest rate, APR, and payment may vary based on the specific terms of the loan selected, verification of information, your credit history, the location and type of property, and other factors as determined by Prosperity Home Mortgage, LLC. Not available in all states. Rate is as of 11/5/2026 and is subject to change at any time without notice. Opinions, estimates, forecasts, and other views contained in this document are those of Freddie Mac’s economists and other researchers, do not necessarily represent the views of Freddie Mac or its management, and should not be construed as indicating Freddie Mac’s business prospects or expected results. Although the authors attempt to provide reliable, useful information, they do not guarantee that the information or other content in this document is accurate, current, or suitable for any particular purpose. All content is subject to change without notice. All content is provided on an “as is” basis, with no warranties of any kind whatsoever. Information from this document may be used with proper attribution.
All first mortgage products are provided by Prosperity Home Mortgage, LLC. (877) 275-1762. Prosperity Home Mortgage, LLC products may not be available in all areas. Not all borrowers will qualify. Licensed by the Department of Financial Protection and Innovation under the California Residential Mortgage Lending Act. Licensed by the Delaware State Bank Commissioner. Massachusetts Mortgage Lender License ML75164. Licensed by the NJ Department of Banking and Insurance. Licensed Mortgage Banker-NYS Department of Financial Services. Also licensed in AK, AL, AR, AZ, CO, CT, DC, FL, GA, ID, IL, IN, KS, KY, LA, MD, ME, MI, MN, MO, MS, MT, NC, ND, NE, NH, NM, NV, OH, OK, OR, PA, RI, SC, SD, TN, TX, UT, VA, VT, WA, WI, WV and WY. NMLS ID #75164 (For licensing information go to: NMLS Consumer Access at http://www.nmlsconsumeraccess.org/)